

From prompt to live widget: how Nexow turns a sentence into a trading dashboard
A look under the hood at how Nexow generates a running, data-connected market widget from a plain-language prompt — codegen, sandboxing and live connectors explained.
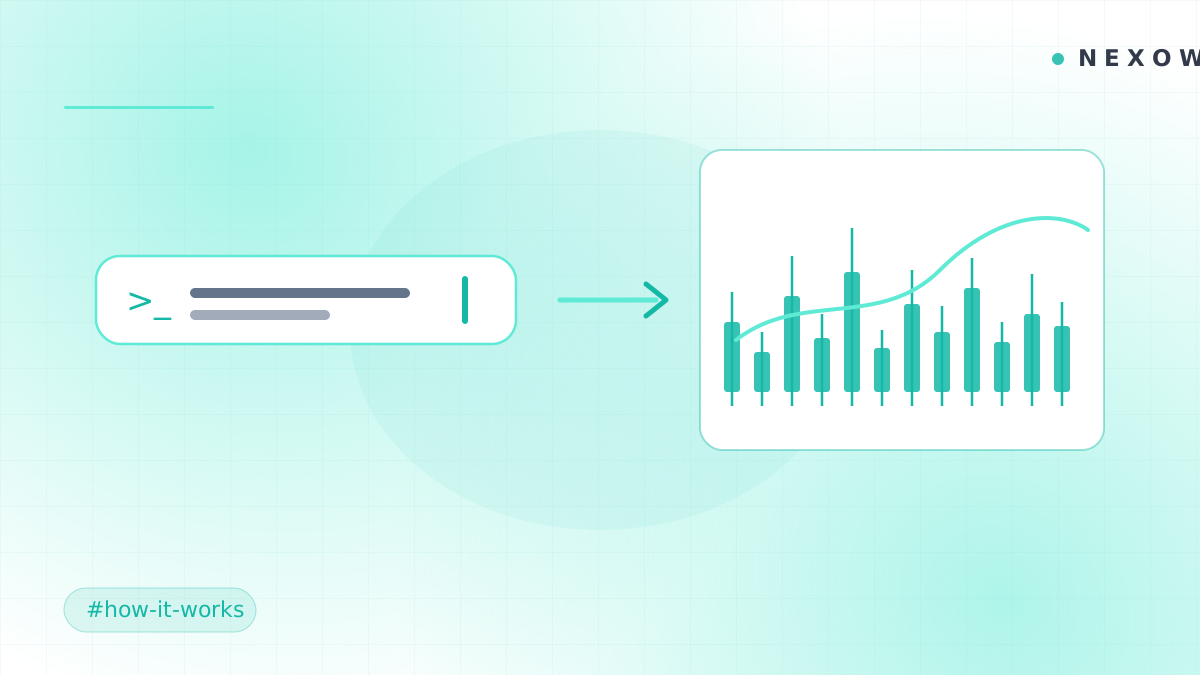
Building a trading dashboard has always meant the same grind: find an API, read the docs, wrangle a websocket, normalize the payload, pick a charting library, fight the layout, and repeat for every instrument you care about. Nexow collapses that entire loop into a sentence.
Here’s what actually happens between typing a prompt and watching a live widget appear on your canvas.
1. You describe what you want to see
A prompt is just natural language:
Show a candlestick chart of BTC-USD from Coinbase with 20 and 50 EMA, and an RSI panel below.
There’s no schema to learn and no configuration file. You describe the outcome — the instrument, the venue, the indicators, the layout — the way you’d describe it to a colleague.
2. Nexow generates the widget’s source
Nexow sends your prompt to Anthropic’s Claude models through the Anthropic SDK, along with the context it needs: which connectors are available, the shape of the data they return, and the runtime contract a widget must satisfy. Claude writes the widget’s actual source code — the fetch logic, the transforms, and the rendering.
Because the model writes real code rather than filling in a fixed template, the range of what you can build is open-ended: order-book depth charts, funding-rate heatmaps, correlation matrices, custom signals, plain tables. If you can describe it, Nexow can usually build it.
3. The widget runs sandboxed
Generated code is powerful, so it runs behind a strict boundary. Every widget executes inside an isolated iframe: it can render its UI and fetch the data it needs, but it can’t reach into your workspace, read other widgets, or touch anything it wasn’t given. Power without the risk.
4. Live data flows in through connectors
A widget is only useful with real data. Nexow ships more than 20 pluggable connectors spanning FX, crypto, equities, futures, options and prediction markets — OANDA, Binance, Coinbase, Kraken, Interactive Brokers, Polygon, Kalshi, Polymarket and more. The widget subscribes to the venue you named, and prices, order books and reference data stream straight in.
Where a venue’s CORS policy allows it, those calls run directly from your browser and never pass through our servers — which keeps latency low and your credentials on your machine.
5. You refine it in plain language
The first generation is rarely the last. Everything stays editable by conversation: “add a 200 EMA”, “switch to a log scale”, “colour the candles by funding rate.” Nexow rewrites the widget in place, versions the change, and keeps a log you can inspect or roll back.
Why this matters
The traditional path from idea to chart is measured in hours. With Nexow it’s measured in seconds, and the artifact you get is a real, inspectable widget — not a black box. The dashboard assembles itself, and you stay in control of the code, the data and the keys.
Ready to try it? Launch the app and describe your first widget.
Build your first widget in the next minute
Open the preview, describe one useful thing, and place it on your canvas.